BlocMetrics
View on github
Summary
Blocmetrics is an app built to solve the problem of tracking user activities on on you web application. Users are able to register their applications through their account. Then, after including a minor javascript snippet into their codebase, which creates “events” in the Blocmetrics database, users have access to visualizations of their own users’ activities.
Explanation
The basic requirements and user stories for this project were provided through the Bloc curriculum, but I implemented the features on my own with limited input from my Bloc mentor, Charlie Gaines. Through building this project I gained insight into the basics of analytics services.
Problems and Solutions
Cross Origin Resource Sharing
In order for Blocmetrics to collect data from other applications, I had to provide an avenue for other origins to make requests to the Blocmetrics API.
The solution to this problem was to provide a javascript snippet that used the built in XMLHttpRequest() method to make POST requests to Blocmetrics. All incoming requests are checked against the applications that a user has registered with Blocmetrics via their URLs. Then only GET, POST, and OPTION request methods are accepted.
The client side javascript:
var blocmetrics = {};
blocmetrics.report = function(eventName) {
  var event = {event: { name: eventName }};
  var request = new XMLHttpRequest();
  request.open('POST', "http://blocmetrics/api/events", true);
  request.setRequestHeader('Content-Type', 'application/json');
  request.send(JSON.stringify(event));
}
is included in the user’s application and then they can define their own javascript events to trigger the blometrics.report() function, which will post events to Blocmetrics.
Data Visualization
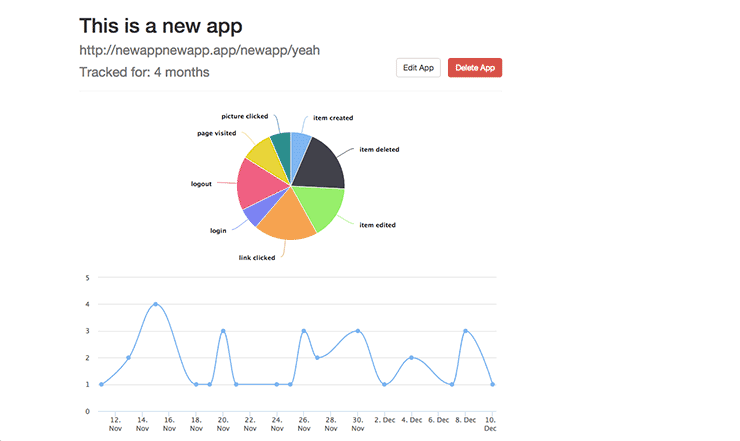
Once a user has registered their application and tracked user events, it would be useful for them to visualize their user data in a more meaningful way. Using the chartkick gem, along with highcharts.js, I was able to provide a way for users to view their tracked events by day and by type.
Features
- Users can register for an account (Authentication implemented with Devise)
- Users can register their web applications by including their URLs
- After including a Javascript snippet in their own application, users are able to create events associated with their registered applications
- Users are able to visualize their events with charts provided by highcharts.js and chartkick
Conclusion
Blocmetrics provided a helpful insight into the basics of analytics services. I was able to learn about CORS and making HTTP requests with Javascript. Working on this project also gave me an opportunity to learn about a few resources for providing graphical representations of data.